A huge viewer spike can make a creator look unstoppable, yet the number may tell only half the story. Looking at top streamer rankings without understanding how the numbers are produced is like judging a football team from one spectacular goal.
Peak viewers, average viewers, hours watched, and chat activity measure very different forms of attention. The real question is not who reached the biggest crowd, but who consistently turned that crowd into meaningful viewing time.
How Top Streamer Rankings Separate Big Spikes From Real Audience Power

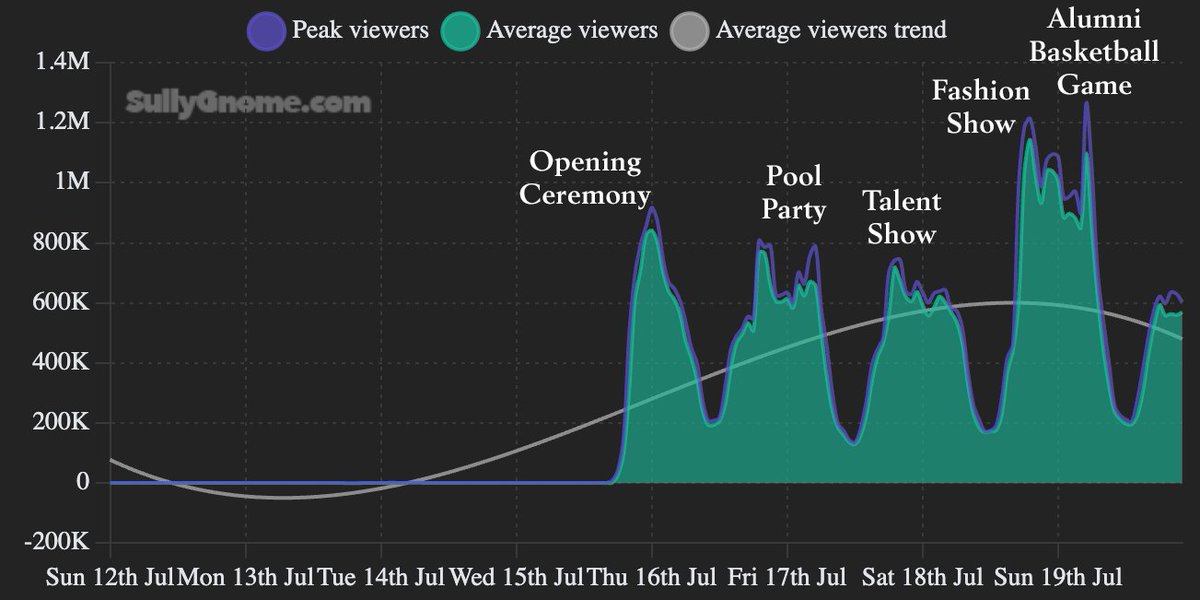
Ranking sites rarely rely on one number because no single metric captures livestream performance properly. Streams Charts, for example, separates Peak Viewers, Hours Watched, Average Viewers, Live Views, and other audience measurements. TwitchTracker also publishes different leaderboards based on average viewers, hours watched, peak viewers, and broader ranking formulas.
1. Peak Viewers Measures Maximum Reach
Peak viewers records the highest number of people watching simultaneously at one moment. It is excellent for measuring the impact of a major event, celebrity appearance, tournament, raid, or viral moment. However, a creator can hit an enormous peak and still have weak performance for the remaining hours.
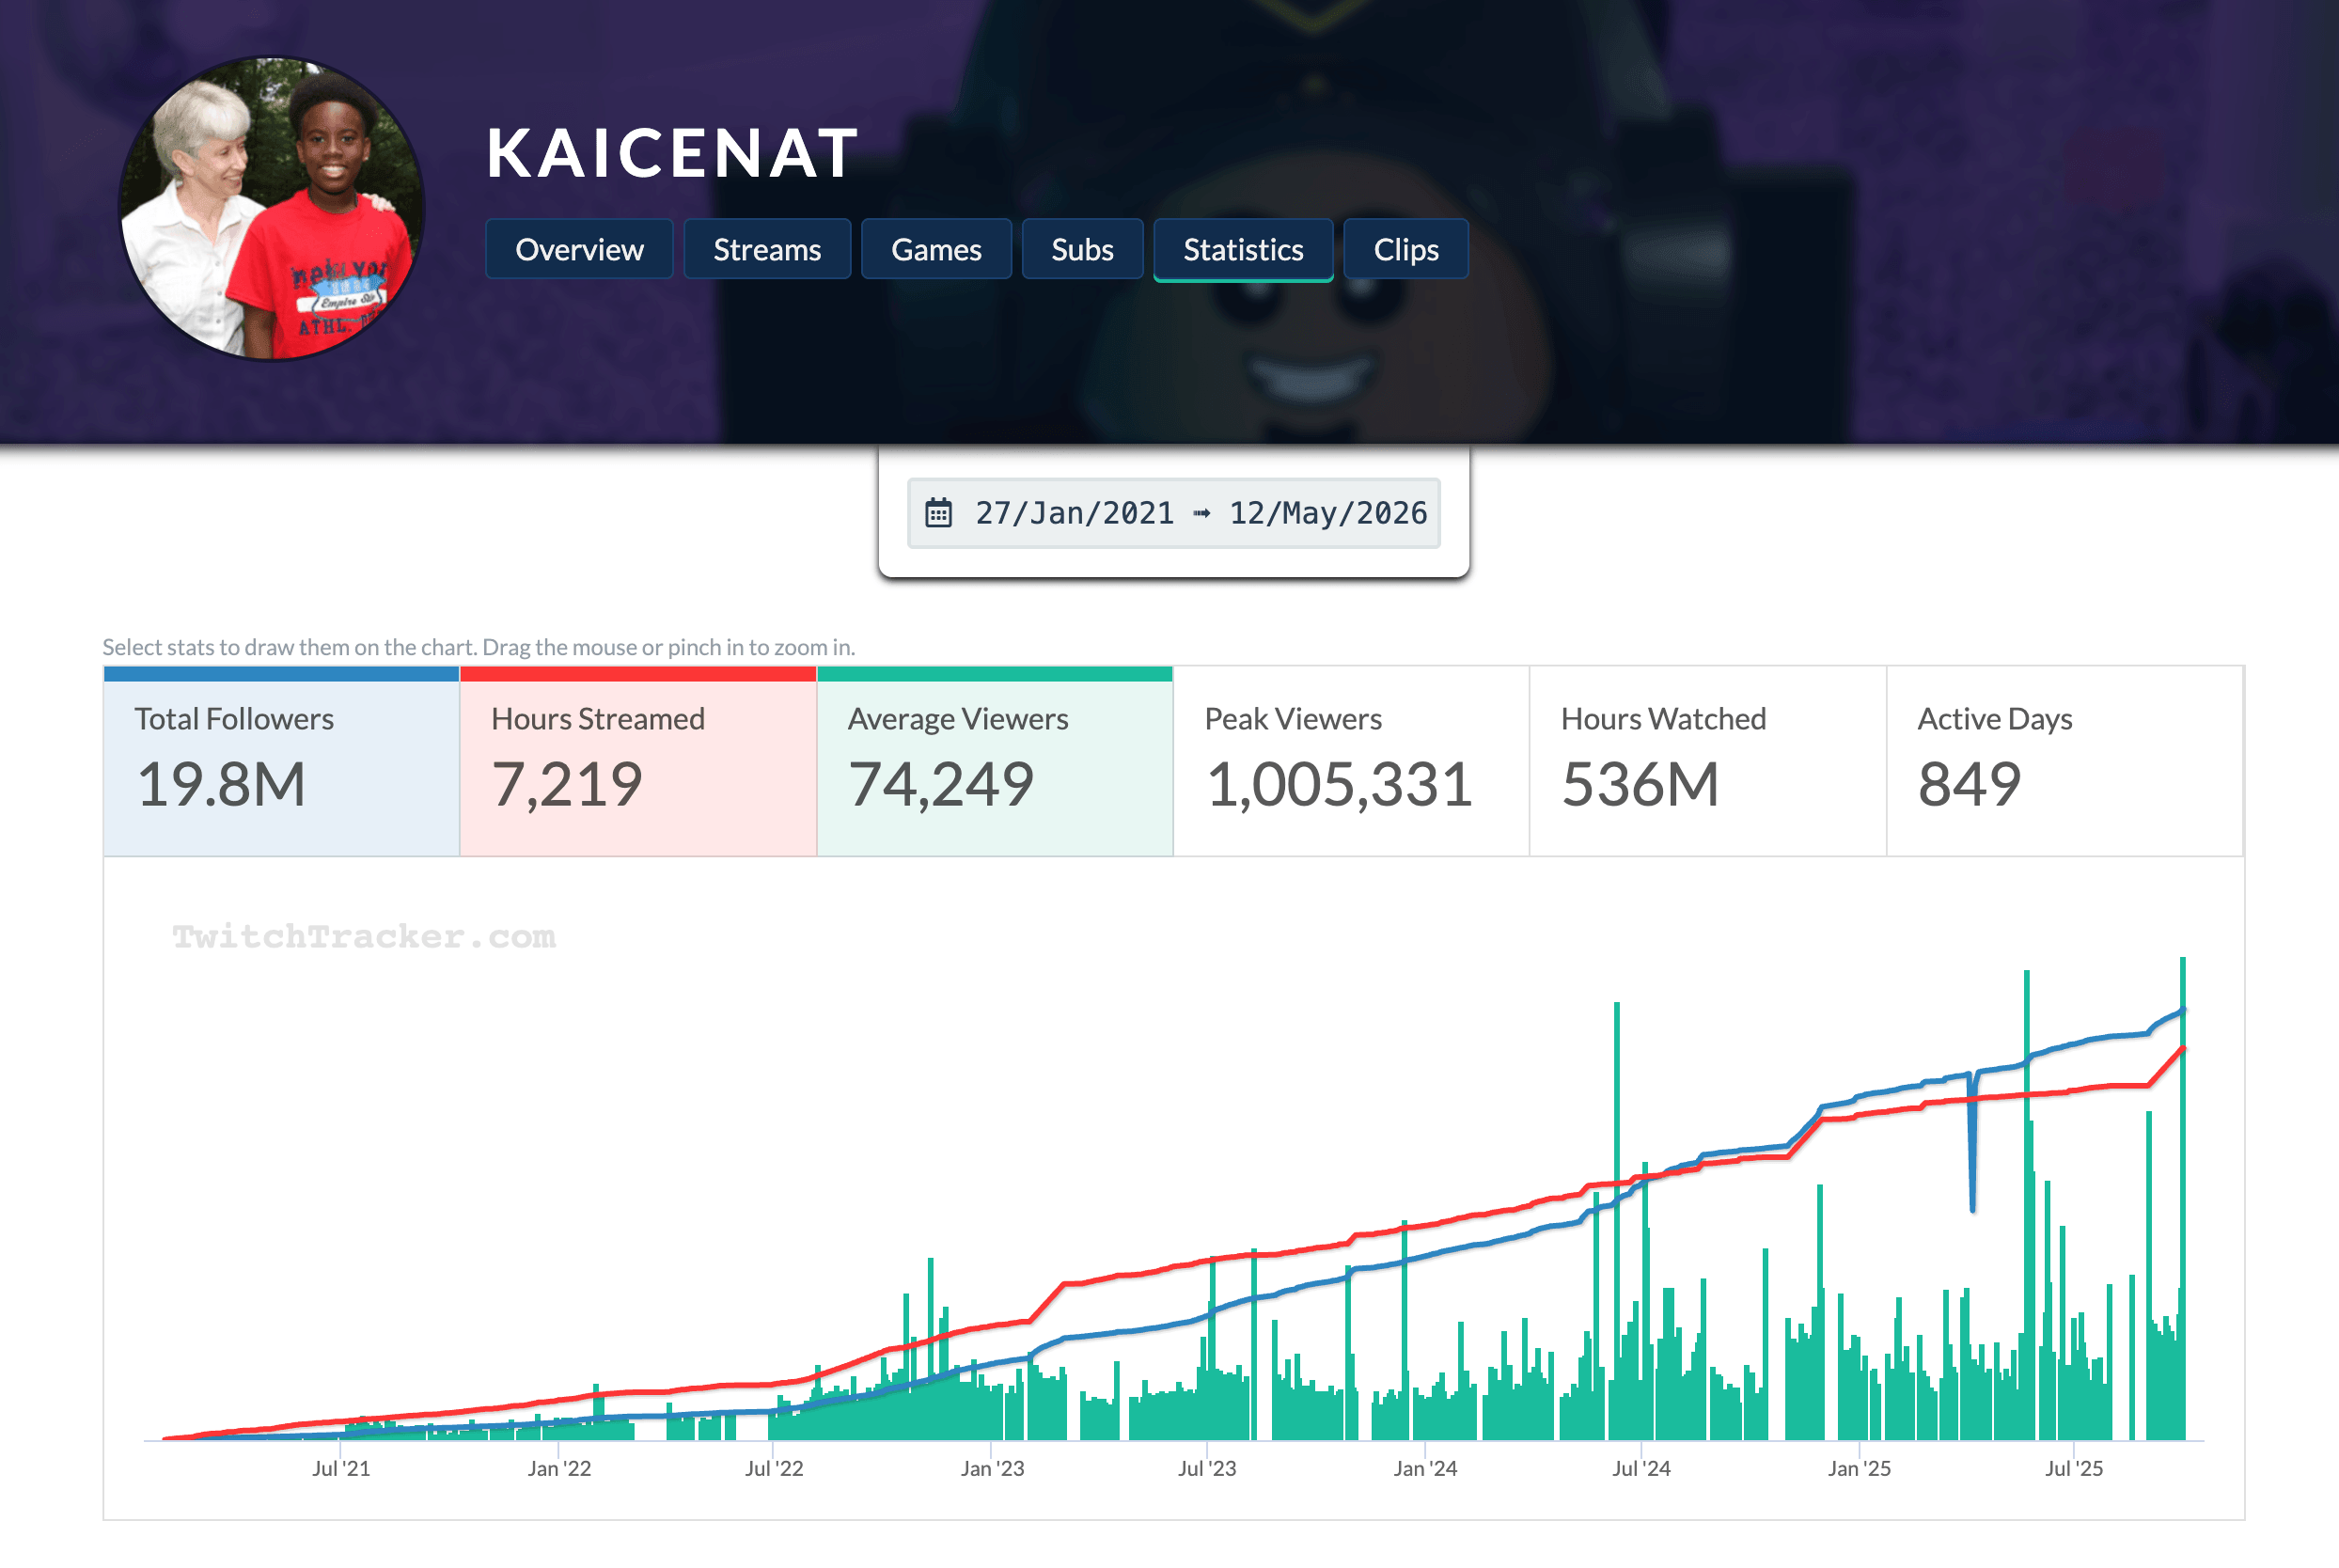
That makes peak viewers powerful but easy to misunderstand. TwitchTracker’s current all-time leaderboard, for example, shows enormous peaks attached to special broadcasts and major creators, including KaiCenat and ibai. A peak proves that a channel can attract attention, but it does not prove that viewers stayed.
2. Hours Watched Rewards Sustained Attention
Hours watched is much harder to fake through one dramatic moment because it accumulates across the entire broadcast. Streams Charts calculates it from average viewers multiplied by airtime, meaning a smaller audience can still generate huge totals when people watch for long periods.
This is why hours watched is especially useful when comparing creators with different schedules. A streamer averaging 40,000 viewers for five hours can generate more total viewing time than someone averaging 70,000 viewers for two hours. In other words, hours watched answers a different question from peak viewers: how much total attention did the creator actually capture?
3. Average Viewers Shows Audience Density
Average concurrent viewers smooths out the dramatic peaks and quiet periods inside a stream. It therefore gives a clearer picture of how many people were typically present rather than how many arrived during one explosive moment.
Current TwitchTracker data illustrates why this distinction matters. In August 2026, Nix leads its personality ranking by average viewers at roughly 119,000, while KaiCenat sits around 73,000 despite having a much larger all-time peak. Neither number alone defines overall influence.
4. Chat Engagement Adds the Human Layer
Viewer counts measure presence, but chat activity can reveal participation. A busy chat during a smaller broadcast may indicate a highly involved community, although raw message counts should never be treated as a perfect engagement score. Spam, bots, repeated messages, and automated activity can distort the picture.
For practical analysis, compare chat velocity with average viewers instead of chasing a single message total. If 20,000 people are watching but only a tiny fraction interact, the community behaves differently from a 5,000-viewer stream where discussion moves continuously. That difference becomes important when evaluating creators for sponsorships, community campaigns, or long-term loyalty.
The Four Metrics That Reveal Whether a Leaderboard Tells the Truth

The smartest way to read a leaderboard is to treat every metric as one piece of evidence. A creator with a spectacular peak but weak average viewing pattern should be interpreted differently from one with stable viewers and strong total watch time. This is also why current rankings can change dramatically depending on whether the leaderboard is sorted by average viewers, peak viewers, or hours watched.
1. Concurrent Viewers vs Peak Viewers
Concurrent viewers describe how many people are watching at the same time, while peak viewers represent the highest point reached during the broadcast. The first is useful for understanding sustained audience size, while the second highlights maximum reach. Treating them as interchangeable can make an ordinary spike look like permanent popularity.
2. Hours Watched vs Stream Length
Hours watched naturally favors creators who broadcast longer, so context matters. A channel streaming 200 hours in a month has more opportunities to accumulate watch time than one streaming 50 hours. The better comparison combines hours watched with average viewers and airtime instead of declaring a winner from one total.
3. Auto Embeds Need Extra Caution
Embedded players can expose streams outside the main platform, but external exposure does not automatically equal genuine engagement. If auto embeds or passive placements inflate visible traffic, analysts should avoid assuming every counted viewer represents an equally valuable community member. The safest approach is to compare multiple indicators rather than relying on one public counter.
4. Rankings Change With The Measurement Window
A weekly leaderboard can reward a viral event, while a 30-day ranking reveals consistency. TwitchTracker currently publishes 30-day rankings, while other analytics services offer different periods and filters. Always check the time window before comparing two creators.
How To Judge A Streamer Beyond The Number One Spot


A leaderboard becomes genuinely useful when it helps answer a business or audience question. Are you looking for the creator with the biggest event reach, the strongest community, the most sustained attention, or the fastest growth? Each goal requires a different interpretation of the same dashboard.
1. For Reach, Watch The Peak
Peak viewers remain valuable when evaluating launches, esports events, celebrity appearances, or major collaborations. A creator capable of attracting hundreds of thousands of simultaneous viewers has demonstrated exceptional event-level reach. But that result should be separated from everyday performance.
2. For Loyalty, Watch Average Viewers
Average viewers are more revealing when the goal is to identify a creator with a dependable audience. Consistency suggests that people are not simply arriving for one viral moment and disappearing afterward. Pairing this metric with returning-viewer data can make the assessment even stronger where that data is available.
3. For Commercial Value, Watch Hours Watched
Brands often care about sustained exposure rather than one impressive screenshot. Hours watched provides a useful approximation of how much total attention a channel generates, although it should still be combined with audience demographics, content category, and engagement quality.
For example, current TwitchTracker data places KaiCenat among the strongest English-language personalities by both average viewers and total hours watched, while other creators rank differently when the metric changes. That is exactly why a single leaderboard position can be misleading.
4. For Community Strength, Watch Chat Behavior
Chat engagement becomes more meaningful when measured relative to audience size and stream duration. Look for recurring conversations, viewer responses to creator prompts, and genuine back-and-forth rather than raw message volume. This qualitative layer can explain why two channels with similar viewer counts produce very different communities.
5. For Long-Term Analysis, Build A Metric Stack
A useful ranking framework can be simple:
- Reach: Peak viewers
- Consistency: Average viewers
- Attention volume: Hours watched
- Participation: Chat engagement
- Growth: Followers gained over the same period
- Context: Stream hours and category
This approach also protects analysts from confusing visibility with influence. The strongest top streamer rankings are therefore not necessarily the ones with the biggest headline number, but the ones that remain impressive after several metrics are placed side by side.
For readers studying livestream formats and community behavior, the distinction between creator-led broadcasting and community-driven streaming is also worth exploring in this community livestreams vs broadcast livestreams comparison.
The Bottom Line
A leaderboard is only as intelligent as the metric behind it. Peak viewers show the biggest moment, average viewers show consistency, and hours watched reveal the accumulated weight of attention, while chat engagement adds important context about participation. The best analysis uses all four rather than crowning a creator from one spectacular number.


Paolo Sarmiento has worked as an entertainment editor, community moderator, and livestream reviewer for digital publications in Southeast Asia.
His coverage includes gaming broadcasts, music performances, talk shows, educational channels, and creator-led events. Rather than ranking content by viewer count alone, he also considers production consistency, audience trust, originality, accessibility, and the quality of community interaction.